
Location Boston, MA
Interests Programming, Photography, Cooking, Game Development, Reading, Guitar, Running, Travel, Never having enough time...
Working On fusion energy at CFS
This Site Made with Astro, Cloudinary , and many many hours of writing, styling, editing, breaking things , fixing things, and hoping it all works out.
Education B.S. Computer Science, New Mexico Tech
Contact site at dillonshook dot com
Random Read another random indie blog on the interweb
Subscribe Get the inside scoop and $10 off any print!
What Do You Visualize While Programming?
I’ve been thinking a bit about thinking while programming lately. A bit confusing I know, but hear me out.
Programming is one of the few occupations that occurs inside our heads so it’s a little funny we don’t talk more about what actually goes on inside those heads.
As a primer for the rest of the post, take 5 minutes to watch this video from Richard Feynman:
That’s where I discovered, at least in this very simple operation of counting, the great difference in what goes on in the head when people think they’re doing the same thing!
And so it struck me therefore if that’s already true at the most elementary level, that when we learn the mathematics and the Bessel functions and the exponentials and the electric fields and all these things, that the imageries and method by which we’re storing it all and the way we think about it could be really, if we could get into each other’s heads, entirely different.
And in fact why somebody sometimes has a great deal of difficulty understanding a point which you see as obvious and vice versa it may be because it’s a little hard to translate what you just said into his particular framework and so on.
Hopefully that gets you thinking about what’s going on in your head while you’re working on a problem. There is a small chance you don’t visualize anything in your head which is a condition called aphantasia. There’s a bit of confusion around what visualizing in your head actually means in those threads but here’s a good explainer video on it.

In a nutshell, when I’m visualizing something I’m seeing it in my mind’s eye inside my head and not actually seeing it with my eyes (or on the back of my eyelids as talked about in the video). It’s definitely connected to the brain’s visual system, but seemingly something along the lines of an induced noisy signal, versus a clear image perceived by the eyes with the direct optic nerve path. I don’t think this is unique to me but I can visualize while my eyes are open as long as there’s not too much visual stimulation.
Going back to the Feynman video though, I’m super curious what goes on in your head while programming and how it might be different than what happens in mine. I’m convinced that a big part of gaining (good) programming experience is developing the right mental models to visualize while problem solving.
Context matters
What you’re seeing in your head is of course very dependent on the exact task at hand as well as the environment you’re in. Programming is not a monotonic activity. Working on an algorithm by yourself in an IDE is different than working collaboratively with a teammate on a system design at a whiteboard which is also different than designing a database schema in an interview. However, in all these cases having the right images in your head to guide you will help.
Hopefully in the process you can get the images out of your head and in front of your eyes to continue the process. I can only speak for myself here, but what I can visualize in my head is capped at about 4Mb of RAM. Anything too complex or detailed I need to get the first part out of my head into the world to look at so I can then visualize the next step and iterate.
What I visualize is closely tied to the best UI or diagram I’ve found for each task. It’s like I can use the tool in my head to accomplish the task without actually looking at it.
Programming Task Visualizations
So to break it down more specifically I want you to think about what your ideal visualizations are for each of the different tasks here and then compare it to what I’ve found works best for me.
1. Systems Design
Let’s start with an easy warmup, designing a system with multiple components. The actual design might not be easy but the tools to visualize it should be. This is the classic “draw boxes on a whiteboard with arrows” trope of CS.
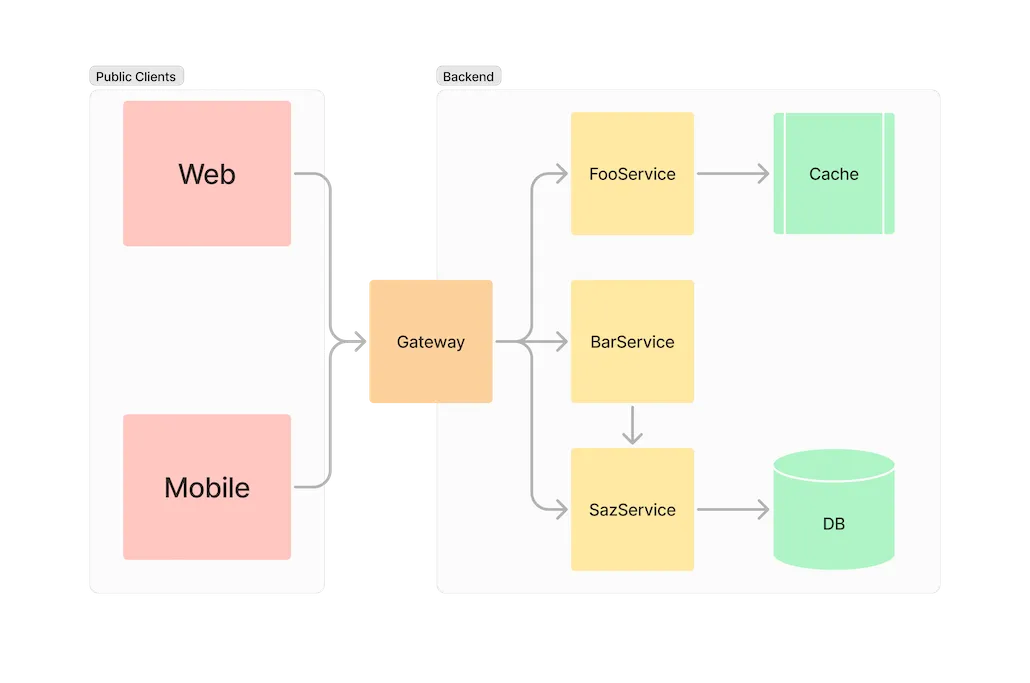
Start with by drawing/visualizing each component, then connect the ones that communicate with arrows, and finally layer on any groupings with surrounding boxes.
2. Designing a Database Schema
Similar to the systems design, the standard ER diagram is the go to here with the properties listed for each table and connected by their foreign key relationships.
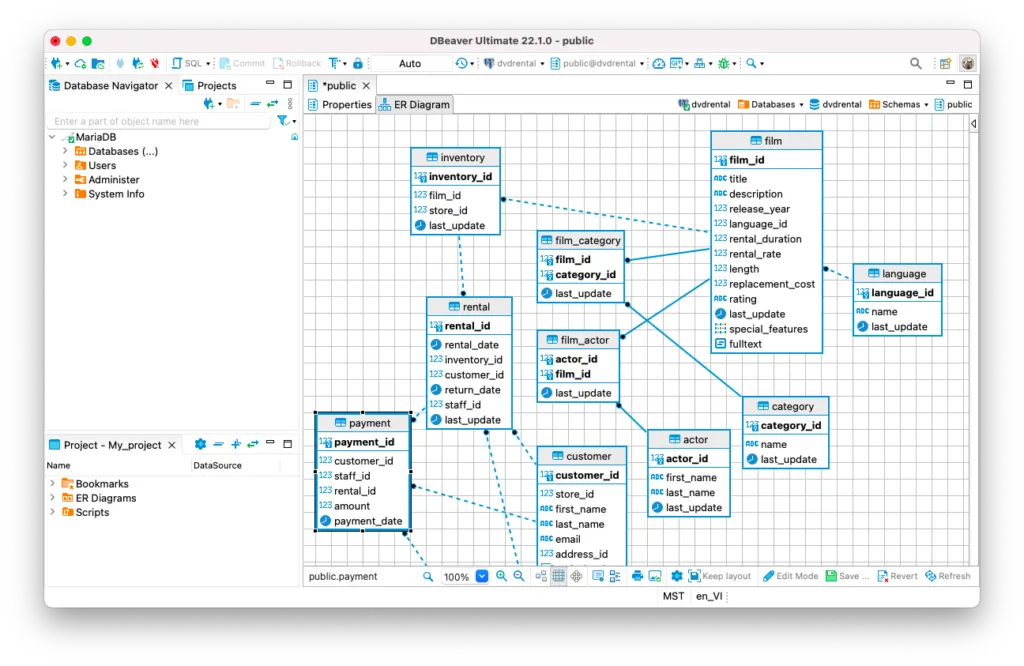
Tools like DBeaver can also generate these diagrams for you.
3. Optimization
For anything execution related I would always like to start with a (distributed if needed) trace along the lines of how Elastic APM shows them.
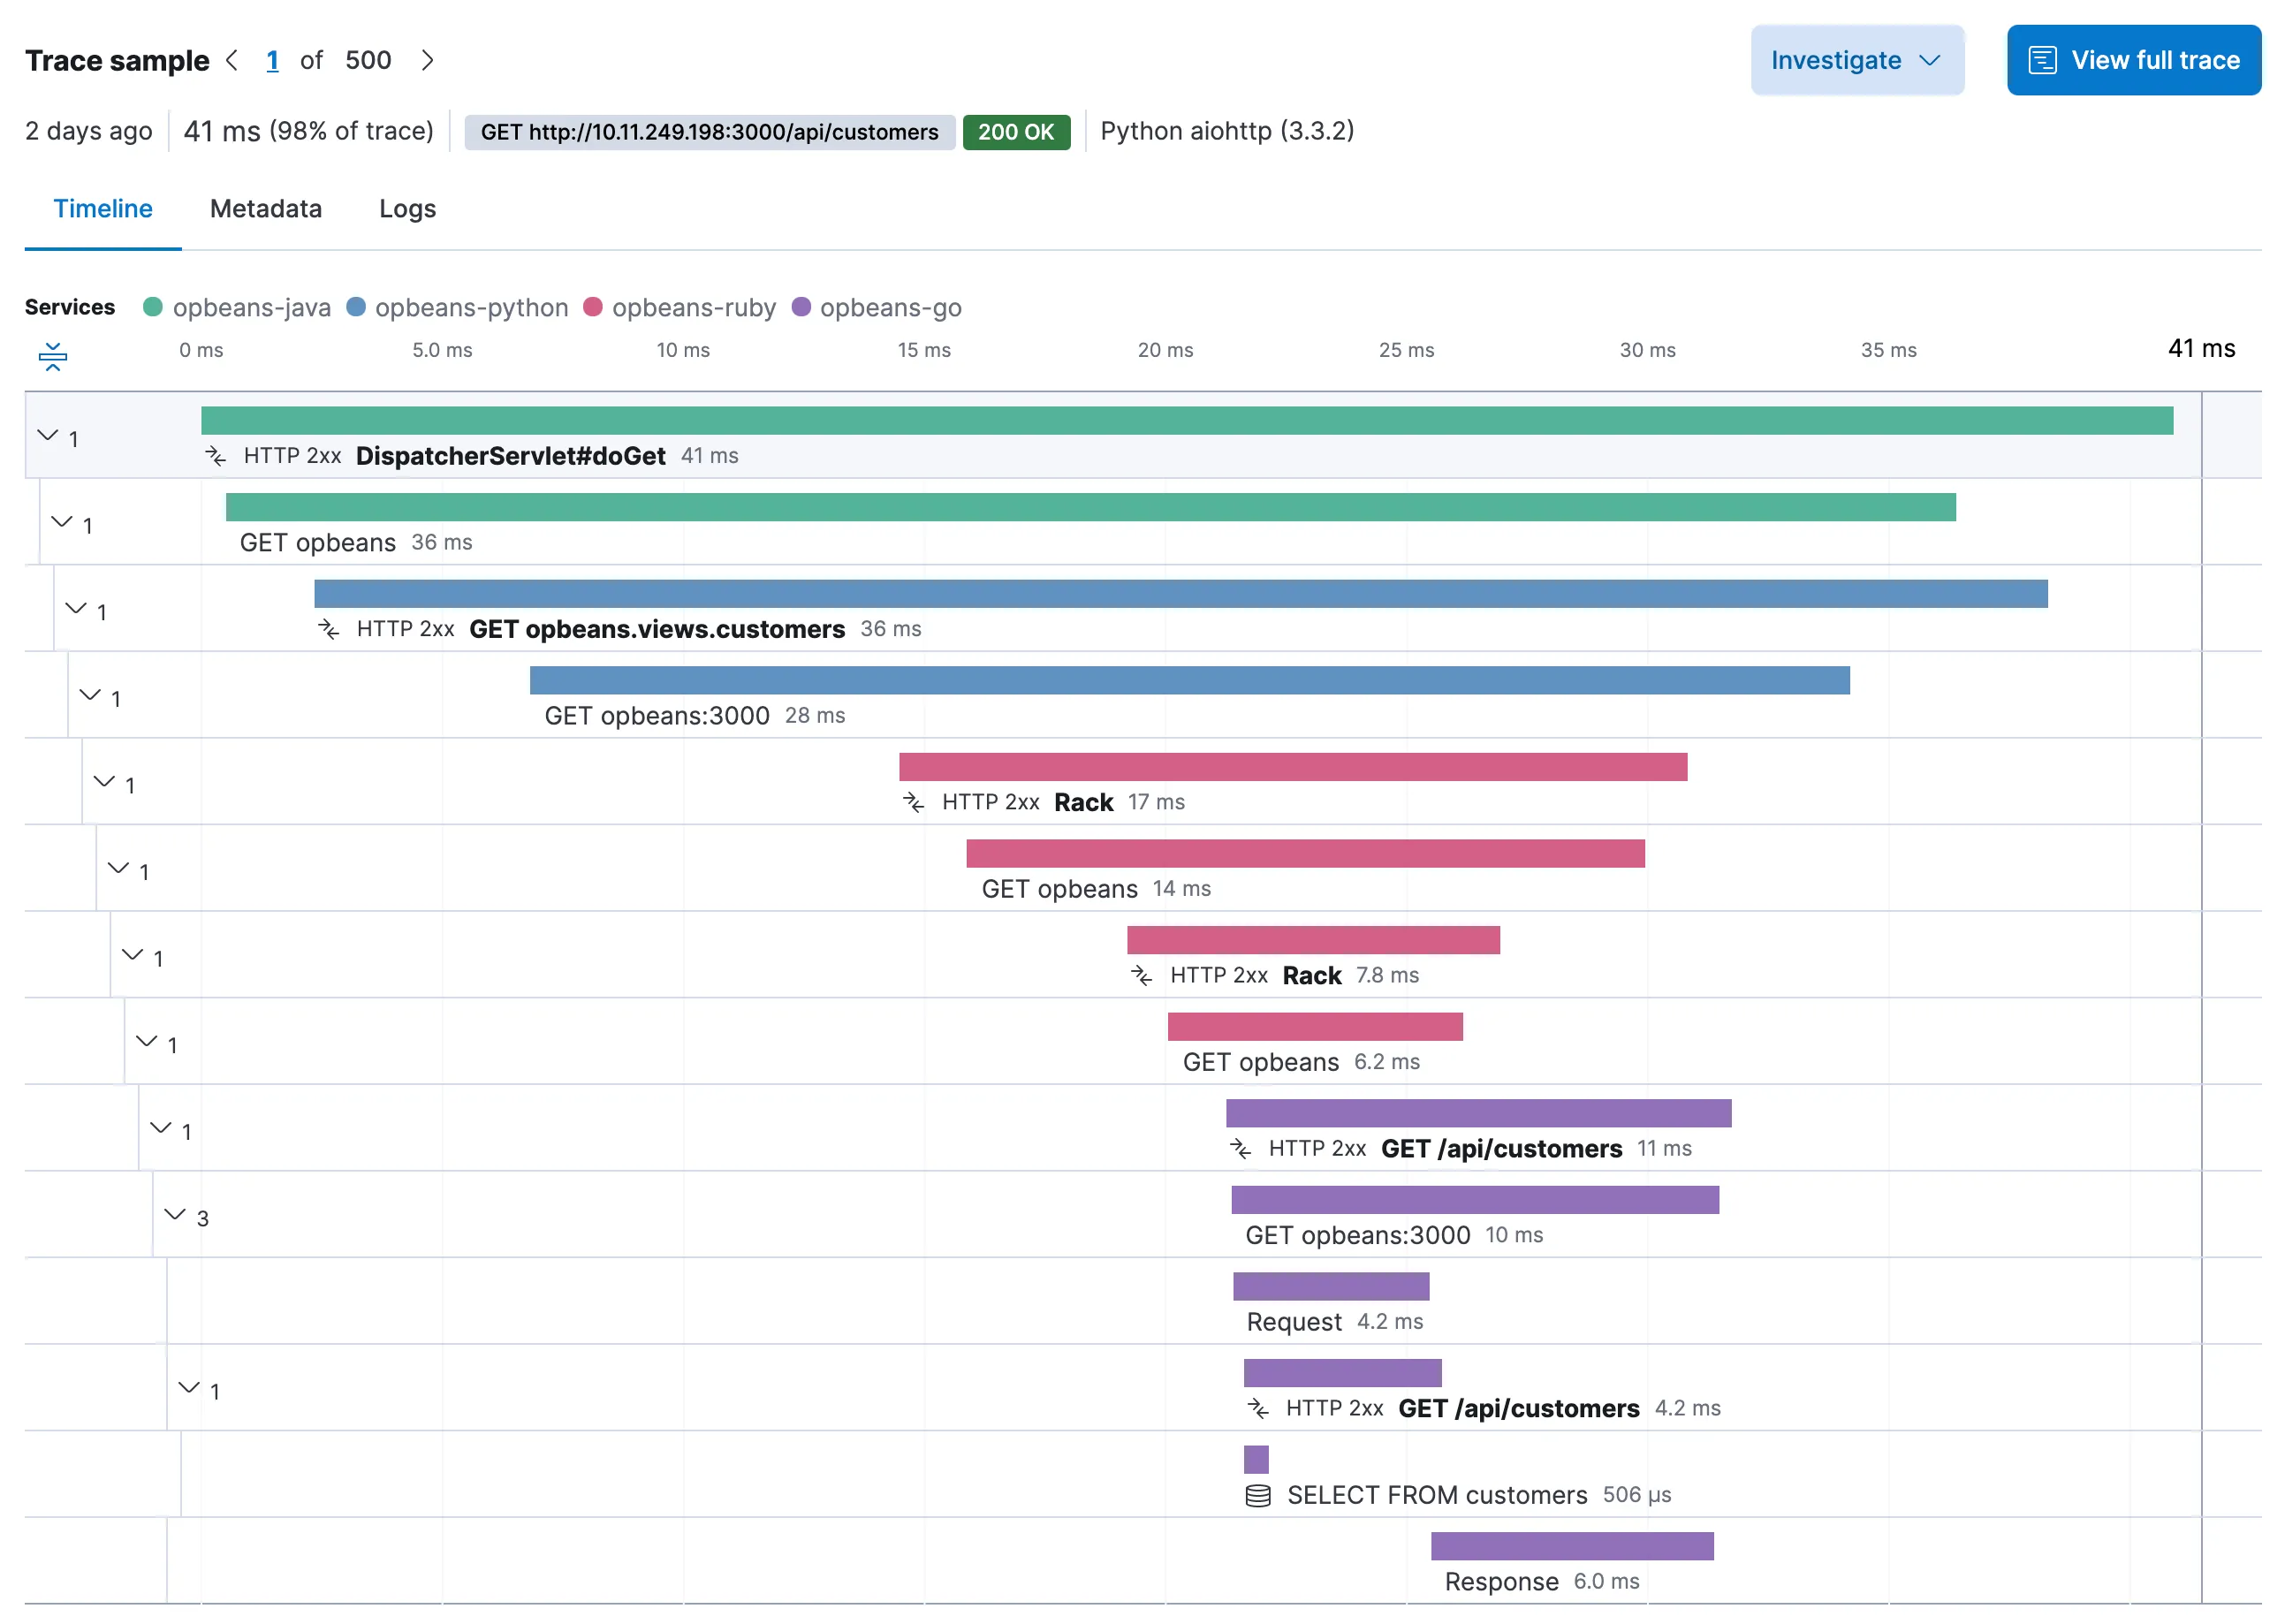
This makes it very easy to see in a glance what’s taking the most amount of time, if there’s a bunch of waterfall requests going on that need to be parallelized, and if there’s too much cross service chatter going on. Flamegraphs are also helpful for optimizing a single process but they really need to be zoomable and have colored groupings to be maximally useful.
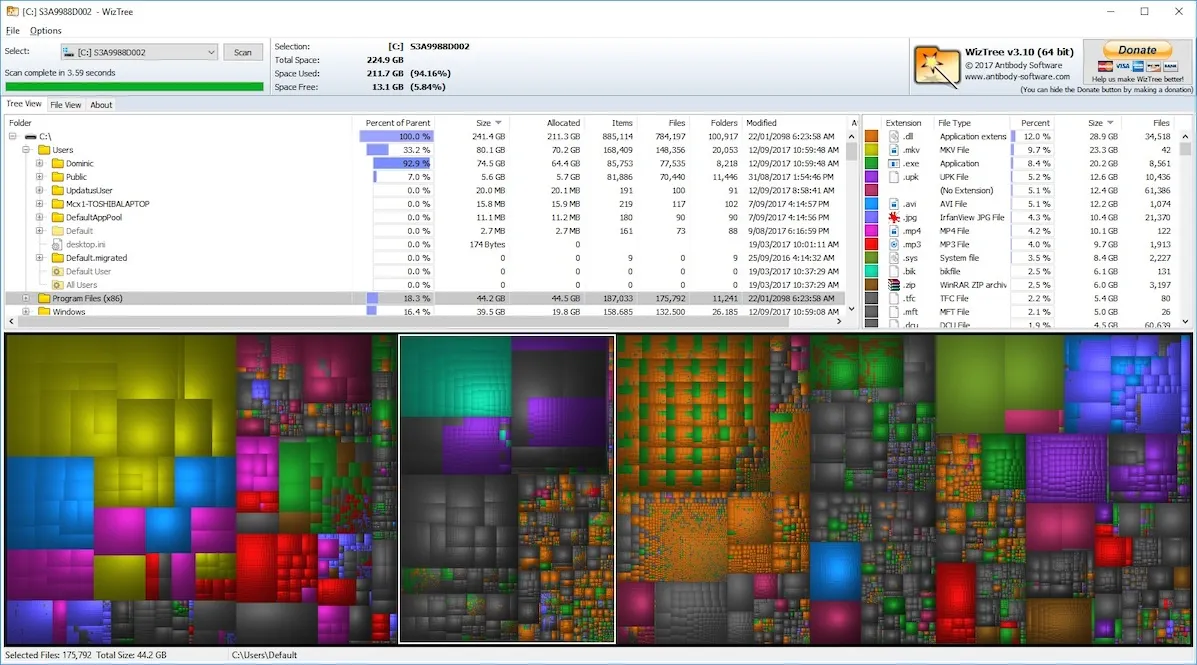
For optimizing anything space related like memory usage or disk space a treemap is invaluable to quickly see what the biggest hogs are at multiple nesting levels.
4. Writing an Algorithm
When writing an algorithm working on a data structure I try to go step by step through the code an visualize the data at its current state as the code proceeds each line. This can easily exceed my working memory capacity though so if you don’t have access to a debugger to record the state at each step it’s a good idea to take notes.
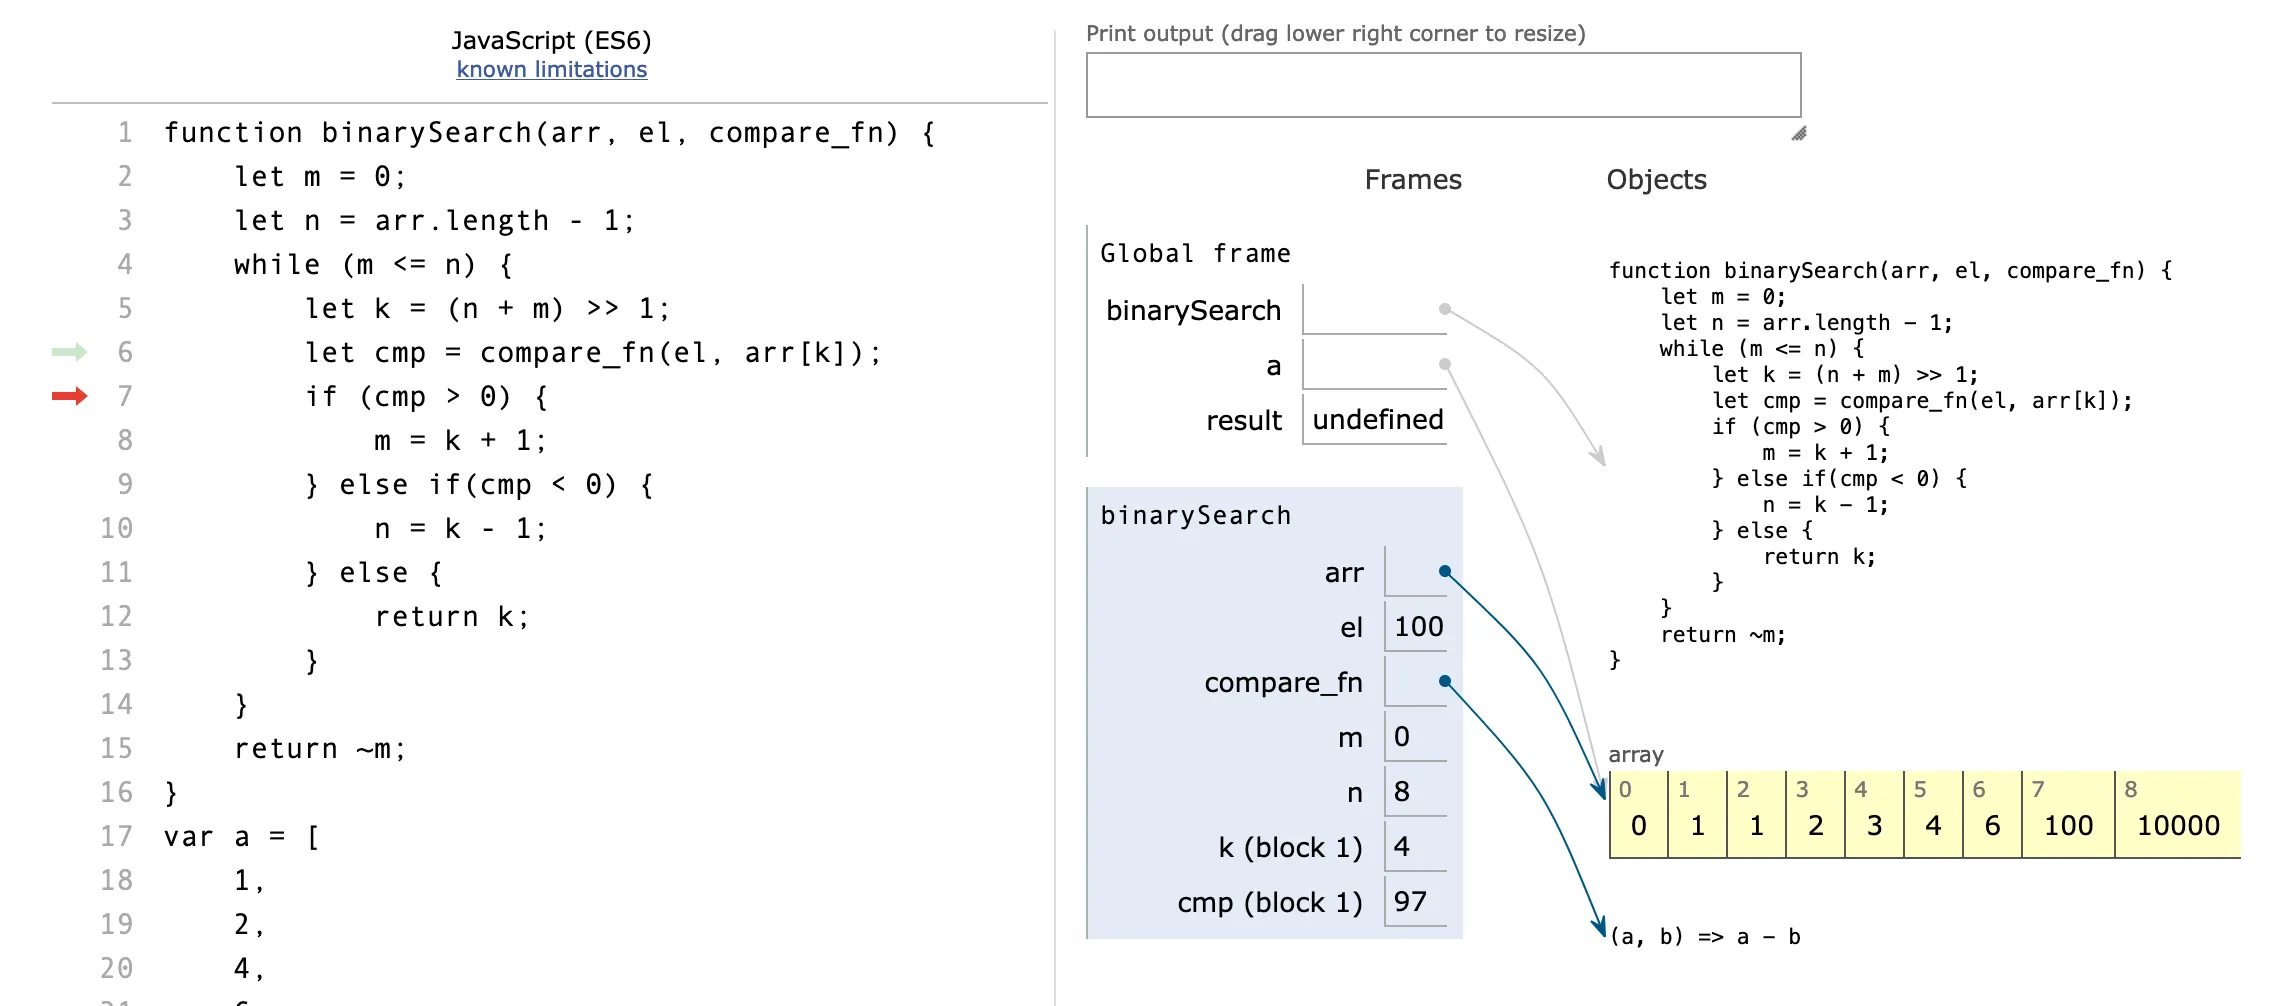
There’s also tools like this code visualizer where the image is from that let you step through code and see a visual representation of your data and the pointers to it.
5. Writing a Recursive Function
This specialized case of writing an algorithm benefits from using a bit of a different technique. In addition to the step by step visualization above you also need to keep track of the call stack as you recurse further and further. Before researching this article I used to a sort of stair stacking diagram with each level being an instance of the function with its state and the next recursive level on top of it. However after finding a few recursion visualization tools online I’m going to try and switch to the tree representation as my default.
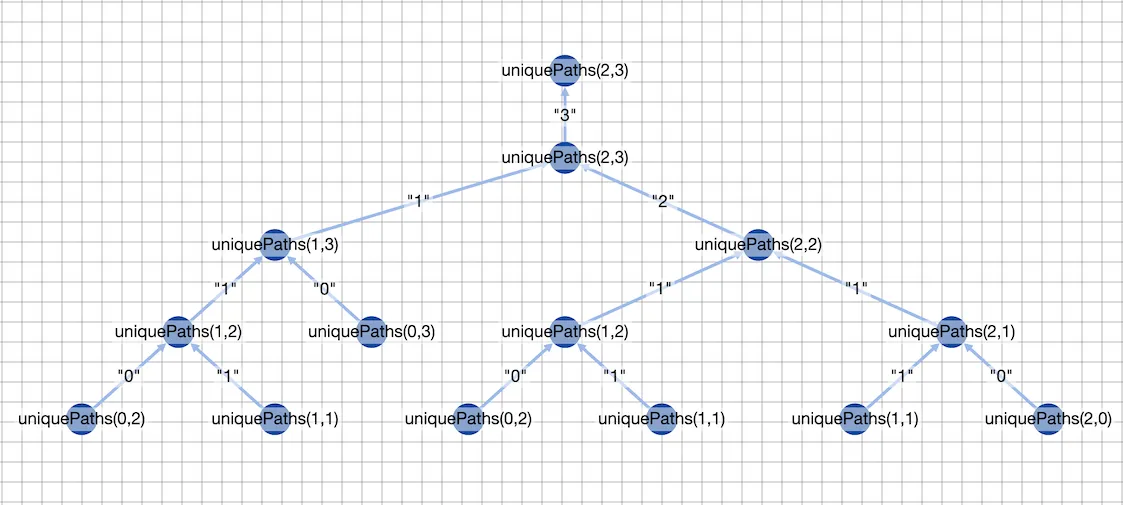
When reading and writing recursive algorithms it’s especially important to start by thinking through the easiest (base) cases first to understand the call flow before increasing the complexity of the example.
Bring Your Visualization Into Focus
When you’re just starting to learn programming you’ll likely be too focused on the minutia of fixing syntax errors, learning your editor, tools, and how computer languages work to really have much of a chance to visualize. But as you advance visualization is a great technique to improve your skills. Like any skill it takes time and effort to gain familiarity and proficiency, but you can improve by setting aside some time to introspect how the visualizations in your head can be optimized to help you think more clearly.
Since the main things I visualize are tools/UI’s/diagrams, the best way for me to improve a visualization is to research all the different tools and diagrams out there for a problem and get familiar with the one that resonates the most so it becomes the de facto image in my head for that particular problem.
What other tools and diagrams do you know of that help you think in more efficient ways? Please let us all know in the comments!
Additional Reading
Sebastian Bensusan: We need visual programming. No, not like that.
Alex Ellis: How do you visualize code?
Nicole Archambault: Visualization Techniques for Programmers (and Why You Should Be Using Them)
Bret Victor: Media for Thinking the Unthinkable
Eberhard Gräther: The Untapped Potential of Software Visualization
Want the inside scoop?
Sign up and be the first to see new posts
No spam, just the inside scoop and $10 off any photo print!